.png)
- Apr 22, 2020
- 2 min read
For the past few months, we have been working on an entry-level logic challenge for secondary school students. Alignment with the Australian Curriculum: Digital Technologies was a firm requirement.
The course is free until the end of June under our COVID-19 policy. It is suitable for remote and self-directed learning.
When students design and implement computer algorithms, they need to think about branching. This is the process of decision-making based on yes/no decisions. For algorithms to decide properly, students need to understand how a computer interprets terms, such as and, or, not, and what happens when these are combined.
In the course, students follow the journey of three young girls, Esther, Brodie and Hannah on their beach trip. Although going to the beach is currently banned in most states due to COVID-19, dreaming about it is still allowed.

The course is highly immersive and interactive. The background responds to user input. The scenes are set at the beach with waves rolling against it, the sun rising, clouds moving in the sky and a ship travelling at the horizon.
Without coding, the course teaches about Bits, AND, OR, XOR, NOT decisions and De Morgan's law and how these can be applied to solve logical day-to-day problems. Students connect logic gates so that information travels precisely in the right way to solve challenges. As a special feature, one of the lessons explores Shakespeare's famous "To be or not to be" from a logical perspective. There are interactive clues available should students get stuck.
The course intentionally avoids truth tables, as these are often overwhelming at the introductory level. Instead, we describe gates by their primary function in natural language. For example, the output of an AND gate is true if both inputs are true. Each gate has a little '?' that reminds students of the function of the gate.
In the Australian Curriculum: Digital Technologies, this course addresses the principles underlying branching in:
ACTDIP019
ACTDIP029
ACTDIP040
The learning outcomes from this course are valuable to understand branching and control structures.
Let us know what you think. We're also very interested to hear your thoughts about future lessons in this course.
To access the course click here.
Until next time,
The Doctor.
Acknowledgements. We thank Esther (Y 12 student), David (Y 10), Yannic (Y 10) and Noah Schulz (Y 7) for their feedback and input on the design of this course.
- Mar 25, 2020
- 1 min read

As more students are learning remotely or from home, we want to provide them, their teachers and parents with affordable and engaging Digital Technologies resources to continue on their learning journey.
For the next three months, all of our online resources will be freely available to all students.
Students can explore artificial intelligence, binary numbers, pixel graphics, algorithms and the inner workings of a computer.
So how does this remote learning experience look like?
Free, immersive online activities at mycomputerbrain.net
Free, comprehensive lesson plans and shorter ones attached to each online lesson
Free assessment tasks
Free explanatory videos
To use mycomputerbrain.net, teachers or home-schooling parents first sign up themselves and then create free accounts for their students. We have described this process in this short presentation in the FAQ (direct link to the PDF).
At the Digital Technologies Institute, we hope you will find these resources useful. Feedback is always welcome.
Stay safe,
Karsten Schulz
CEO and Founder
Acknowledgements. We want to thank a great many teachers and parents who keep pushing forward with educating young learners under challenging circumstances.
- Mar 4, 2020
- 3 min read

Artificial Intelligence is a bit of a mystery. We feed data into some magic algorithm, which then drives a car, manage a supply chain or decides if something we write is nice or offensive.
But how does it work?
To investigate, we thought that many of us know how to work with Excel™, so we said, "how hard can it be to export an Artificial Neural Network into an Excel spreadsheet?". And that's what we did.
To keep things simple, we decided to make a very small ANN in the MyComputerBrain online platform that consists of just nine perceptrons (neurons). It is very basic, but it can determine if the majority of three input fields are either white or black. Not bad. We then trained the ANN and generated the spreadsheet file. If you'd like to tag along, you can find it here.
The first image shows the ANN in the browser window:

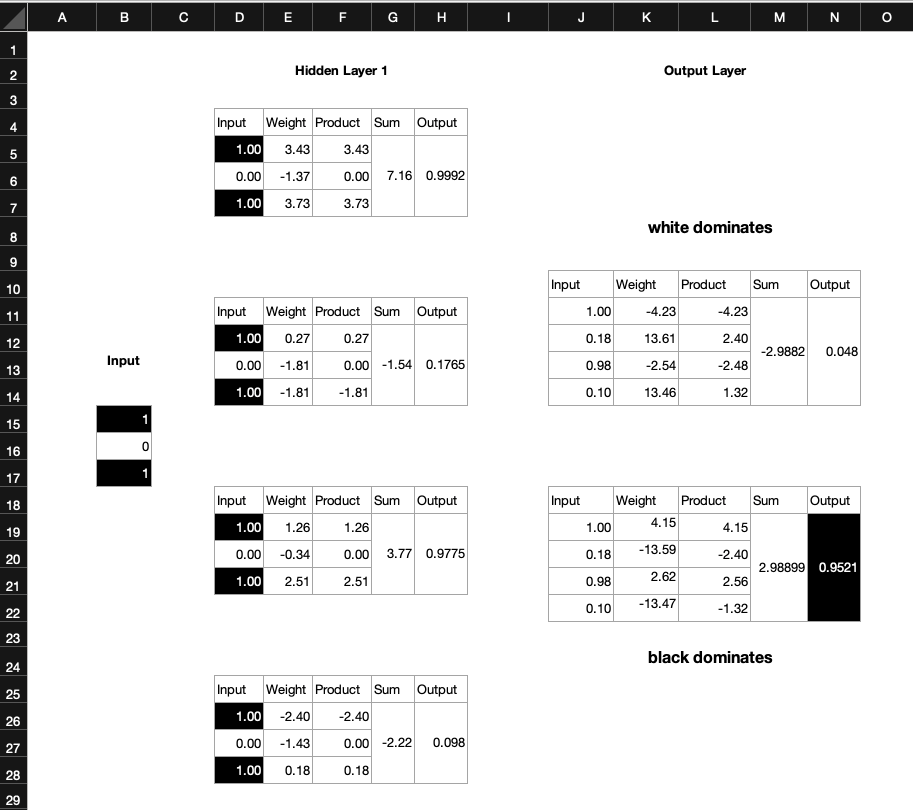
And here is the corresponding representation in spreadsheet format.

The spreadsheet AI has one out of three inputs black and two are white. Correspondingly, it shows at its output the white dominates.
If we now switch a second input to black (value =1), then the output flips to 'black dominates'.
We can try this out with all possible combinations of black and white inputs. The AI is properly trained and will give us the correct result.
Note a couple of interesting things:
The output will never be exactly 1. Yes, it will be close, like 0.9521, but never 1.
The spreadsheet does not contain any IF-statements in the form IF (B15==1) AND (B17==1), THEN N19=1. That's because we haven't programmed the scenario into the spreadsheet. All that we've done is exporting the weights and the math that links the fields together.
But does it work? Select the cell D5 in Excel™. Note that it links to B15. So the input of the hidden layer comes straight from the output of the input layer. Confirm this with the other hidden layer input cells D6, D7, D12, D13, D14, etc.
The weights in the perceptrons are all constants. They came out of our browser AI and are the result of the learning process. Our Spreadsheet AI uses them.
The product cells are the simple product of input and weight. E.g. F5, F6, F7. for the first hidden layer perceptron. In each perceptron, the products get summed up, and you find them in cells G5, G12, G19, G26. Each sum is then pushed through a Sigmoid function (see below) in H5, H12, H19, H26, which produce the output of each perceptron. These outputs are then used as inputs of the next layer, the output layer perceptrons. Note that each output layer perception has four inputs (one for each hidden layer perceptron). If this sounds confusing, just look at the arrows in the browser AI.
Each of the output perceptrons then does the same thing that each hidden layer perceptron did: Multiplying the input with the weight factor (product), summing up the products and pushing them through the Sigmoid function.
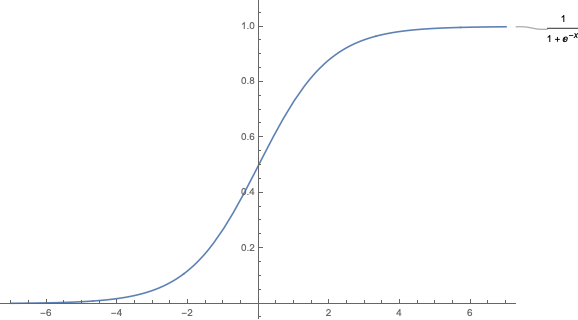
At this point you might ask yourself how the Sigmoid function looks like. Let's plot it. Note that the output of the function approximates 0 and 1, but it will never reach those values. Now you understand why the output of our AI can never be exactly 1.
If you like, you can play with the weight factors. Go and change them and observe when the spreadsheet AI will become erratic.
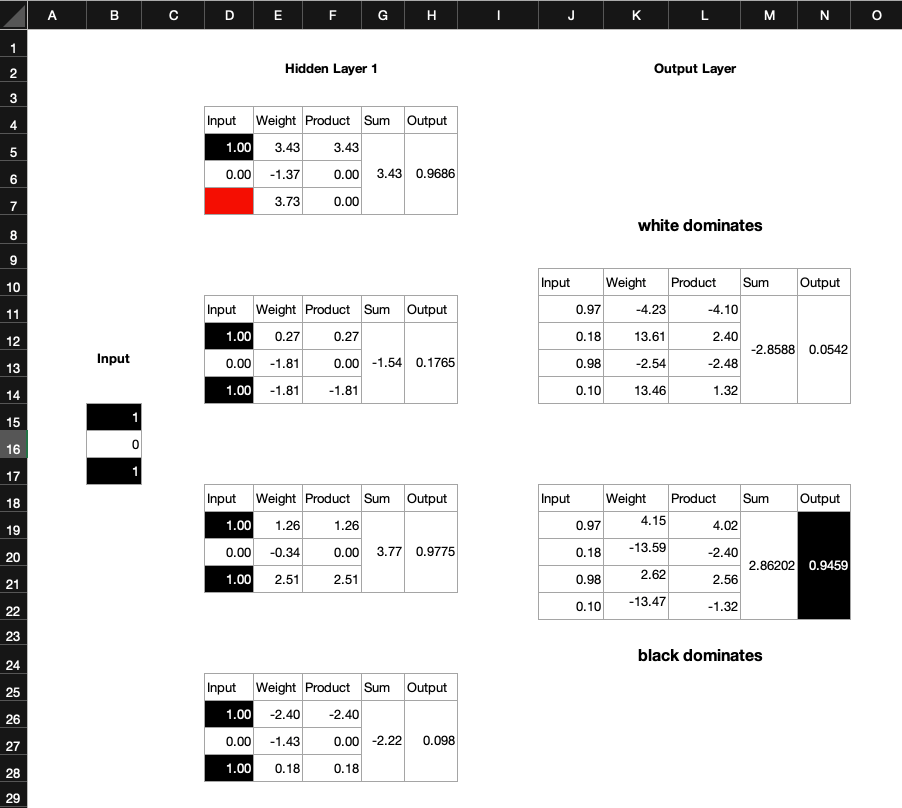
Every perceptron contributes a tiny little bit to the overall solution. If you like, you can change the formulae in the input layer and exclude some perceptrons from the calculations. Your AI might still work. I have just removed the third input of the first perceptron in the hidden layer (highlighted in red) and the Spreadsheet AI still thinks that the black fields dominate, which is correct. Note how the output value has slightly decreased from 0.952 to 0.9459. Our AI is a little but less certain.
Now we perhaps understand why brain surgeons can remove parts of a (human) brain and the patient is still able to function. In our little surgery here in this blog, we have essentially severed a synapse.
But let's go back to the beginning. The 'magic', if we want to call it that, in an artificial neural network is the arrangement of the perceptrons, their interconnectedness and the weight factors, which are the result of a learning process, called back-propagation. How we get to these weights is going to be the result of a separate blog. For now, I hope this one has shed some light on the inner workings of a tiny AI.
Let me know what you think.
Until next time,
The Doctor.
Acknowledgements. We'd like to thank the Digital Technologies Hub for their contributions to the inspiration of this scenario.


